Introduction: The Need for Budget-Friendly MVP Analytics
The pressure is real. As a solo founder, you’re on the hook to deliver data-driven results right from the get-go. But let’s be honest: you’re unlikely sitting on a pile of venture capital. That’s where budget-friendly MVP analytics dashboards come into play. They help you keep tabs on what’s working—and what isn’t—without burning a hole in your pocket. Many non-technical founders grapple with decoding analytics while juggling tight budgets. You need something that’s not just easy on the wallet but also simple to use. That’s where some strategic direction can be a game-changer—consider our Clarity service for guidance on MVP essentials.
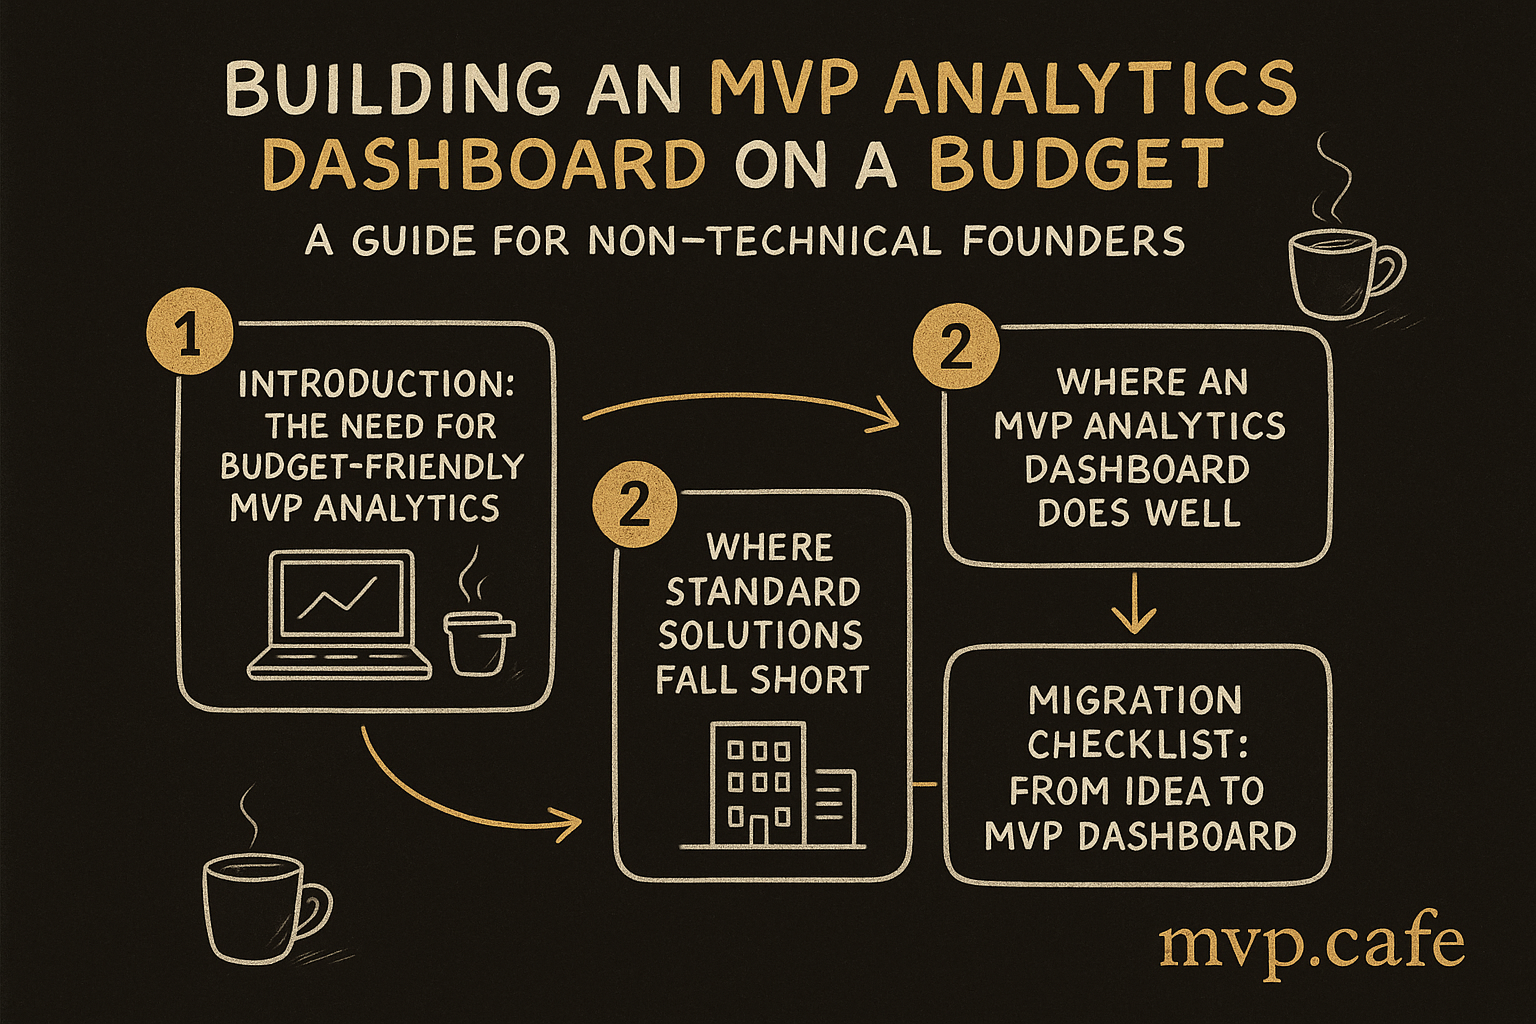
What an MVP Analytics Dashboard Does Well
Think of an MVP analytics dashboard as your startup’s mission control. It keeps an eye on key metrics like user acquisition, engagement, and churn rates. Real-time data insights allow you to make swift pivots when necessary. At ZYOD, we honed our MVP by zooming in on fabric cycle reduction and working capital improvements. Dashboards are more than just a collection of numbers—they’re stories. Stories that help you get a grip on your users and refine your product. For a closer look, check out examples from ZYOD’s MVP journey.
[INLINE IMAGE: Key metrics every MVP should track]
Where Standard Solutions Fall Short
Standard analytics tools can feel like a maze. They’re often overpriced and unnecessarily complicated. Imagine forking out ₹8-12 Lakh for a tool that leaves you more confused than clued in. Plus, they generally demand a level of technical know-how many solo founders just don’t possess. The lack of customization options can be a deal-breaker. You need something that fits your MVP’s unique needs—not a generic solution that raises more questions than it answers.
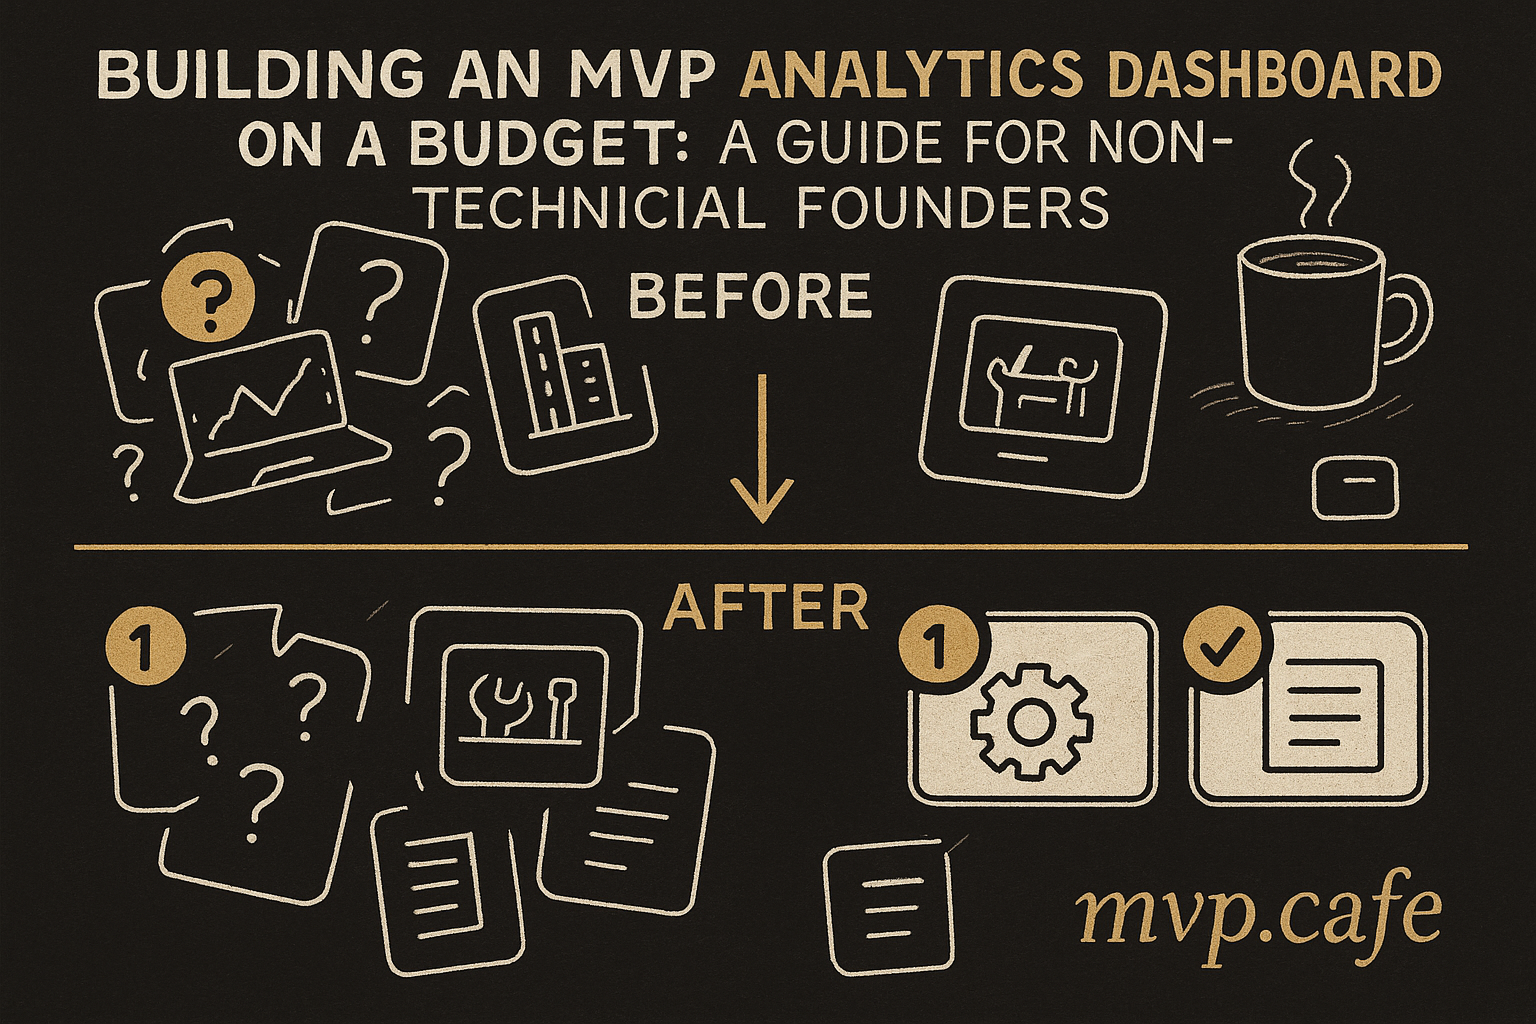
Migration Checklist: From Idea to MVP Dashboard
Here’s your roadmap to a functioning MVP dashboard:
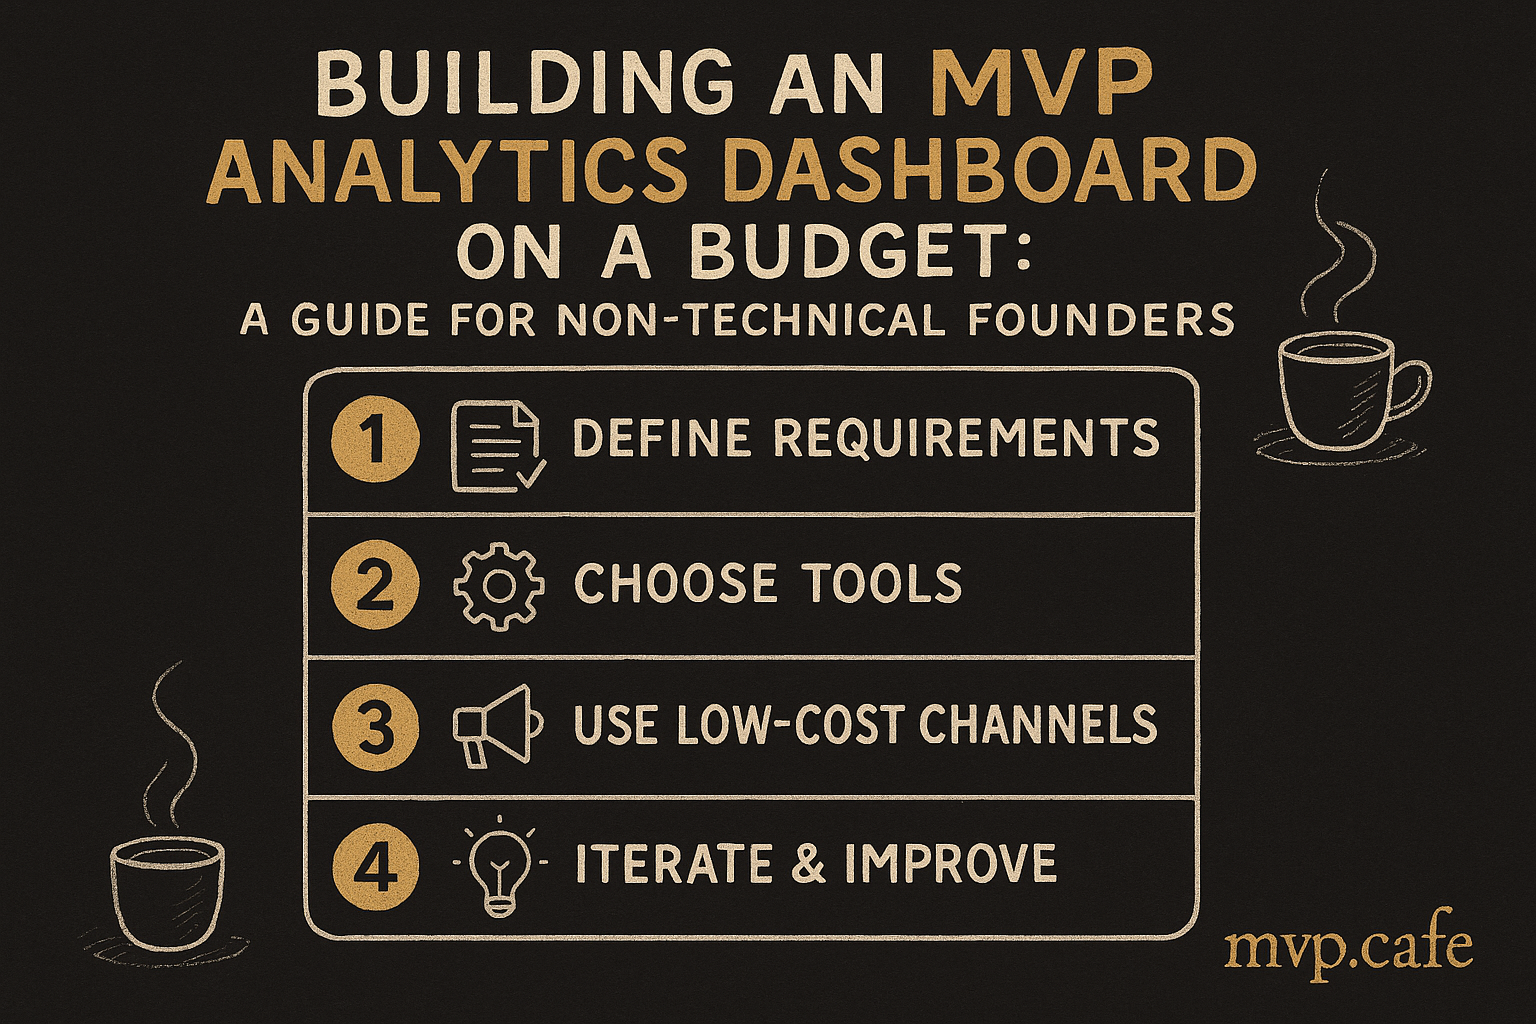
- Define Your Needs: Pinpoint the metrics crucial to your MVP.
- Choose Your Tools: Opt for budget-friendly options like Google Analytics or Mixpanel.
- Set Up Your Framework: Install and configure these tools to kickstart your data collection.
This checklist will steer you toward building an MVP analytics dashboard that won’t empty your pockets.
[INLINE IMAGE: Checklist for building an MVP analytics dashboard]
Step-by-Step: Building Your MVP Dashboard
To kick things off, select affordable tools. Google Analytics is free and solid; Mixpanel offers a generous free tier. Integrate these tools with your MVP by inserting tracking codes or using plugins. Once they’re in, start testing. See if your dashboard accurately mirrors user actions. Tweak it based on feedback. If a metric doesn’t add value, adjust it. Your dashboard should evolve alongside your MVP.
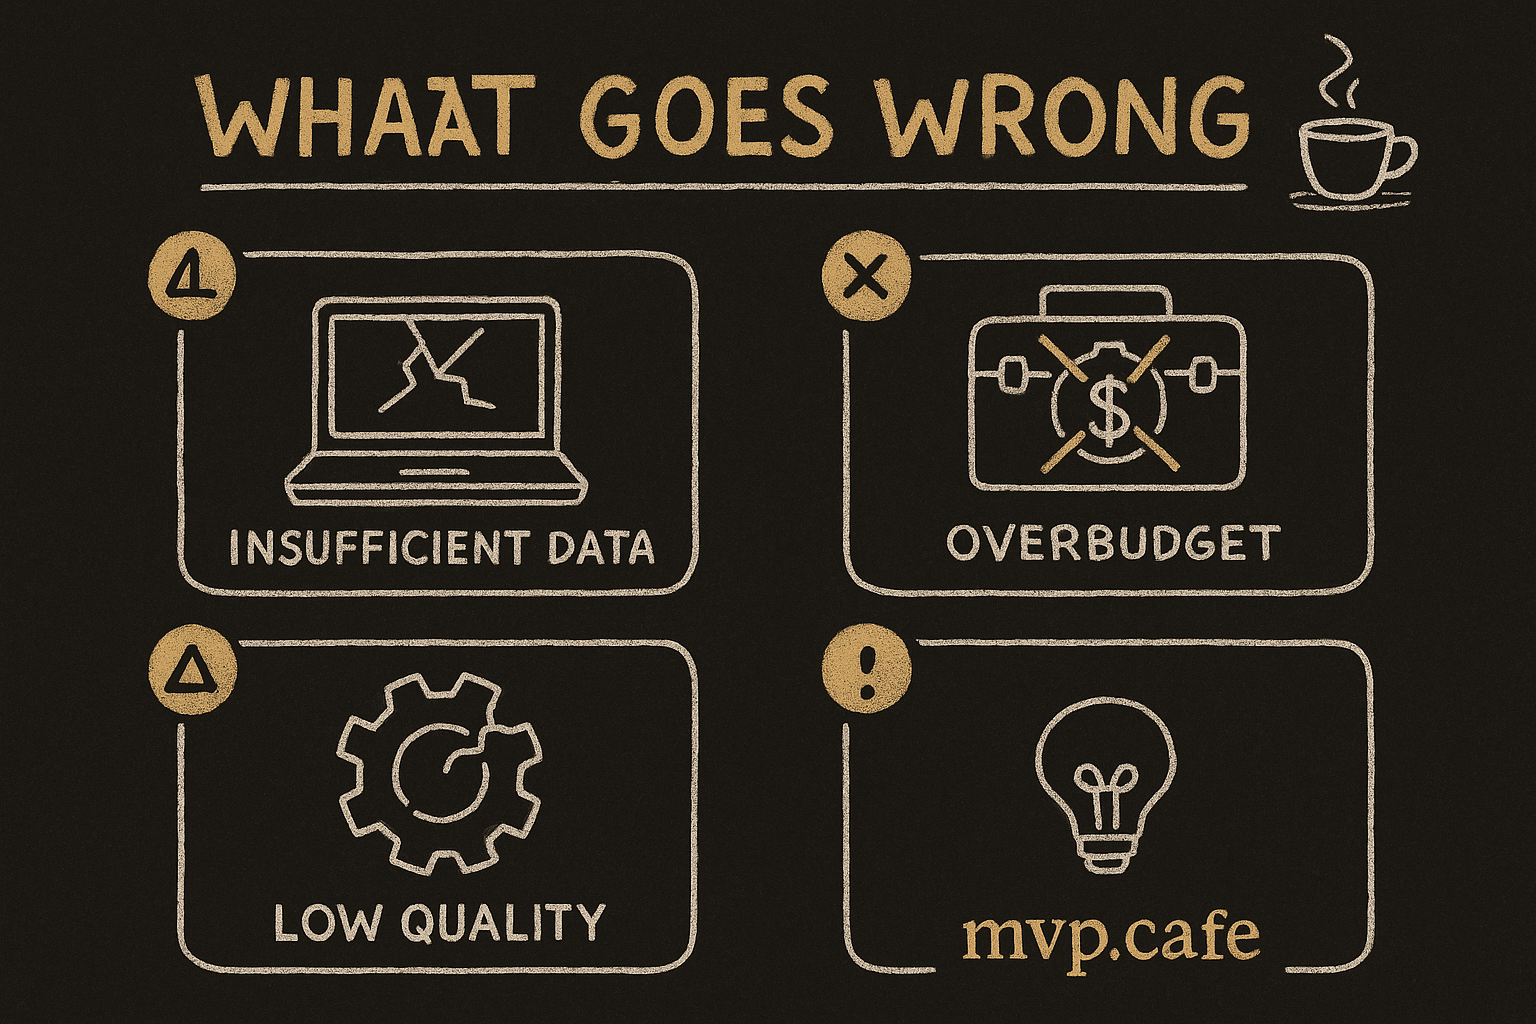
Common Pitfalls and How to Avoid Them
Building a dashboard isn’t without its hiccups. Avoid cluttering it with too many metrics. Focus on what’s actionable. Ignoring user feedback is another mistake. Your dashboard should reflect real user behavior, not just your assumptions. Regular updates are crucial. Data is dynamic; your dashboard needs to be too. Keep it current to stay ahead.
Conclusion: Empowering Solo Founders with Analytics
A well-constructed MVP analytics dashboard empowers you to make informed decisions. It helps you understand what’s working and where you need to pivot. Don’t let budget constraints hold you back. Take action and build your dashboard today. And if you need hands-on help, our Works service is designed to guide you through the complete MVP build, including analytics.
This isn’t just about saving money; it’s about building something that actually works. So, get started and let those data-driven insights propel your startup journey.