
The Only 5 MVP Metrics That Actually Matter (Ignore Everything Else)
Your analytics dashboard has 47 charts. You check them daily. You feel productive.
You’re not.
Most of those numbers are noise. At the MVP stage, tracking too many metrics is worse than tracking none — because it gives you the illusion of insight while hiding what’s actually happening.
Here are the only 5 metrics that matter when your product is young. Everything else is a distraction.
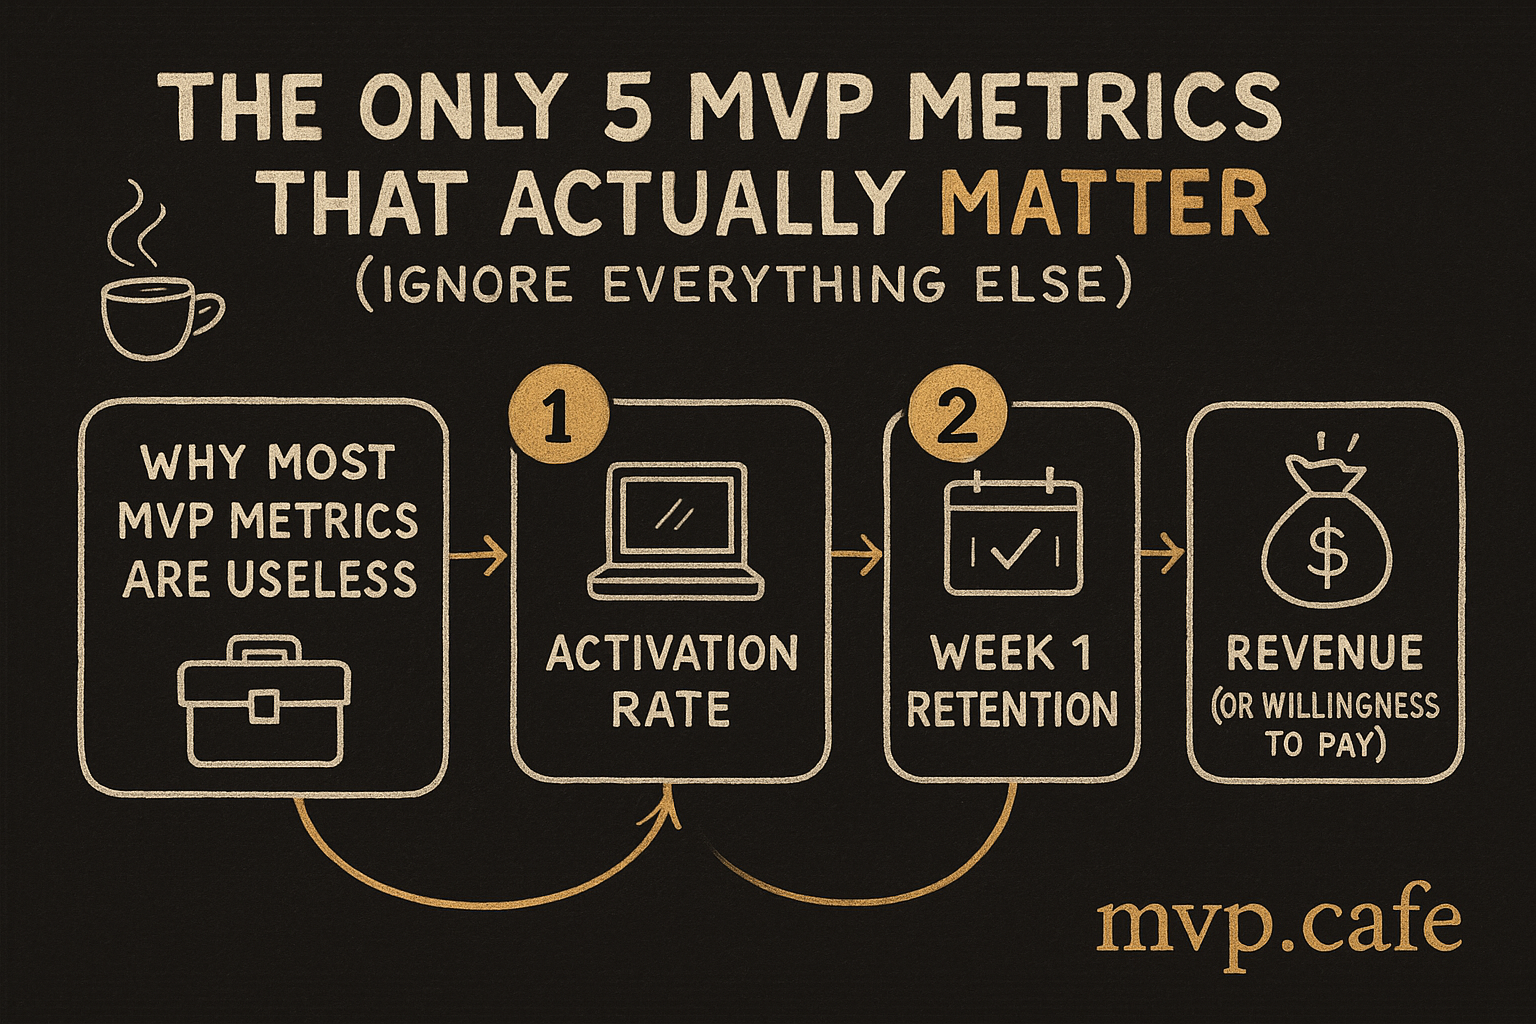
Why Most MVP Metrics Are Useless
Before the list, let’s kill some sacred cows:
Page views don’t matter. A million people can see your landing page. If none of them sign up, you have a marketing experiment, not a product.
Total signups don’t matter. 500 signups sounds great until you realize 480 of them never came back.
Feature usage heatmaps don’t matter yet. You have 30 users. Statistical significance requires thousands. You’re reading tea leaves.
NPS doesn’t matter yet. With fewer than 100 active users, NPS is a survey, not a signal.
What DOES matter: metrics that answer one question — “Is this thing working?”
Metric 1: Activation Rate
What it is: The percentage of signups who complete the core action that delivers your product’s value.
Not: Signed up. Not: Clicked around. IS: Did the thing your product exists for.
Examples:
- Task management app → Created a task AND completed it
- Analytics tool → Connected a data source AND viewed a report
- Marketplace → Listed an item OR made a purchase
- SaaS → Completed onboarding AND used the core feature
Why it matters: This is the single best predictor of retention. If people sign up but never activate, your onboarding is broken — not your product (probably).
What “good” looks like at MVP stage:
- 🔴 Below 20% — Your onboarding has a wall. Find it.
- 🟡 20-40% — Normal for MVPs. Improve it, but don’t panic.
- 🟢 40-60% — Solid. Focus on retention now.
- 🔥 Above 60% — Unusually strong. Focus on growth.
How to improve it:
- Talk to people who signed up but didn’t activate. Ask: “What stopped you?”
- Reduce steps between signup and first value moment. Every click is a dropout.
- Send a “Hey, you signed up but haven’t tried X yet” email at 24 hours.
Metric 2: Week 1 Retention
What it is: The percentage of activated users who come back at least once in the 7 days after activation.
Why week 1, not month 1: At the MVP stage, you don’t have the luxury of waiting 30 days for signal. If someone doesn’t come back within a week, they’re probably not coming back.
Why it matters: Retention is the truth serum of product-market fit. Growth can be bought. Retention can’t.
What “good” looks like:
- 🔴 Below 15% — Your product might solve a real problem, but not well enough. Or it’s a one-time-use product (which changes your business model).
- 🟡 15-30% — There’s something here. Find who’s retaining and why.
- 🟢 30-50% — Strong signal. These users have a real need.
- 🔥 Above 50% — You might have product-market fit. Don’t mess with it.
How to improve it:
- Segment retained vs. churned users. What’s different about them? (Company size? Use case? Acquisition channel?)
- Build for the retained segment. Ignore the rest for now.
- Add a reason to come back: weekly reports, notifications, new content, collaborative features.
Metric 3: Revenue (Or Willingness to Pay)
What it is: Actual money from customers. Or, if pre-revenue, validated willingness to pay.
Why it matters: Revenue is the only metric that can’t be gamed, misinterpreted, or rationalized away. Someone gave you money. That’s real.
If you’re pre-revenue, track “willingness to pay” signals:
- How many people clicked “Buy” even if checkout isn’t built yet?
- How many responded “yes” to “would you pay $X?”
- How many signed up for a waitlist with a price attached?
- How many asked about pricing without being prompted?
What “good” looks like:
- 🔴 Zero revenue, zero interest after 30+ days live — Rethink the value prop or the audience
- 🟡 Some interest, no conversions — Pricing or packaging problem, not a product problem
- 🟢 First 5-10 paying customers — You have signal. Double down.
- 🔥 Organic referrals leading to purchases — Growth engine starting
How to improve it:
- Ask non-converters: “What would make this worth paying for?”
- Test pricing changes (up AND down — you might be too cheap)
- Add urgency: founding member pricing, limited spots, time-limited offer
Metric 4: Qualitative Feedback Intensity
What it is: Not a number — a feeling. How passionate are your users’ responses?
This is the metric that analytics can’t capture but founders who talk to users can feel.
Strong signals (you’re onto something):
- Users send you feature requests without being asked
- Someone says “I’ve been looking for this for months”
- Users recommend it to someone else unprompted
- People complain when it’s down (they NOTICED it was down)
- Feature requests are specific and thoughtful, not generic
Weak signals (something’s off):
- “It’s nice” (the kiss of death)
- Users give polite, noncommittal feedback
- Nobody complains when you ship a bug
- Feature requests are vague or contradictory
- People use it but can’t explain why to someone else
How to measure it: Talk to 5 users per week. Not surveys. Conversations. 15 minutes each. Ask:
- “What would you do if this product disappeared tomorrow?”
- “Have you told anyone about it?”
- “What’s the most frustrating thing about it?”
If the answer to #1 is “I’d find something else” — you don’t have product-market fit yet. If the answer is “I’d be really annoyed” — you’re close. If the answer is “I’d be screwed” — you have it. Scale.
Metric 5: Time to Value
What it is: How long it takes a new user to experience the core value of your product.
Why it matters: Every minute between signup and “aha moment” is a minute where the user might leave. The best MVPs deliver value in under 5 minutes.
Examples of great time-to-value:
- Canva: Choose a template → editing in 30 seconds
- Stripe: Paste a code snippet → accepting payments in 5 minutes
- Notion: Open a template → organizing work immediately
- Superhuman: Email triaged with keyboard shortcuts → inbox zero in minutes
Examples of terrible time-to-value:
- “Import your data from 3 sources before you see anything useful” (30+ minutes)
- “Complete your profile, invite your team, set up integrations” (days)
- “Wait for our team to configure your account” (1-3 business days)
What “good” looks like:
- 🔴 Above 30 minutes — You’re losing most people. Find a shortcut to value.
- 🟡 10-30 minutes — Acceptable for complex products. Optimize ruthlessly.
- 🟢 2-10 minutes — Strong. Most self-serve SaaS should aim here.
- 🔥 Under 2 minutes — Exceptional. Your product probably grows virally.
How to improve it:
- Record 5 people signing up (screen share). Where do they hesitate?
- Pre-fill everything you can. Smart defaults > configuration.
- Offer a “quick start” path alongside the full setup.
- Show value BEFORE asking for setup. Let them play first, configure later.
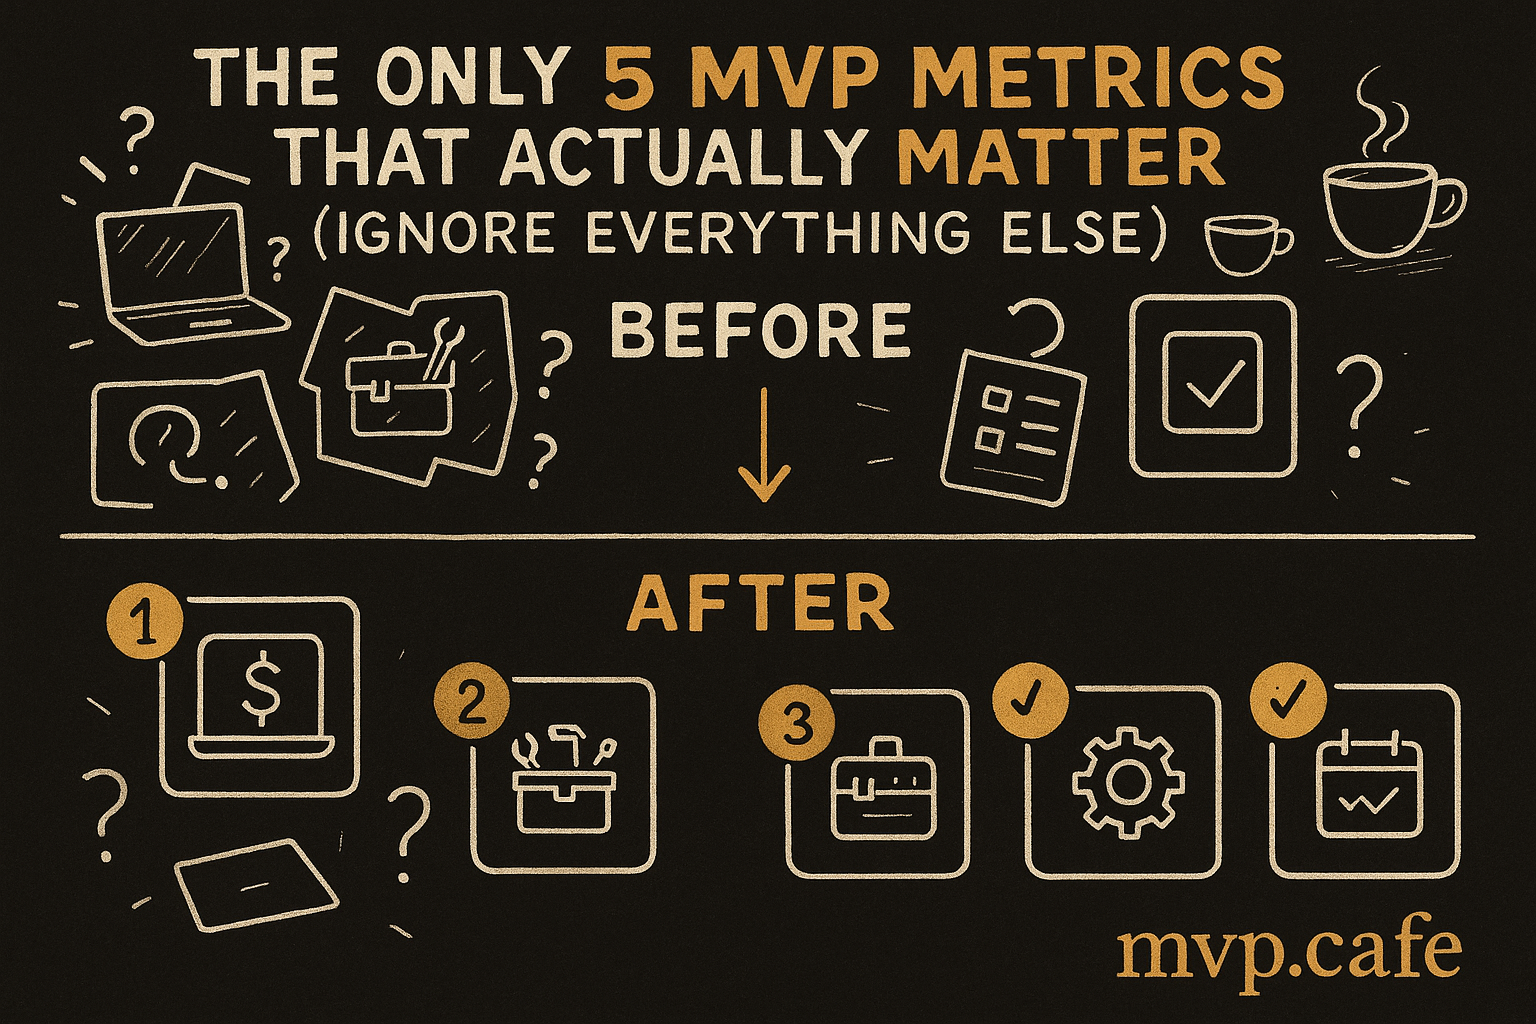
The Dashboard You Actually Need
Forget the 47-chart analytics dashboard. Build this one:
┌─────────────────────────────────────┐
│ WEEKLY MVP HEALTH CHECK             │
├─────────────────────────────────────┤
│ New Signups:        ___             │
│ Activation Rate:    ___% (target: 40%)  │
│ Week 1 Retention:   ___% (target: 30%)  │
│ Revenue This Week:  $___            │
│ Time to Value:      ___ min         │
│ User Convos:        ___ (target: 5) │
│                                     │
│ Trending: ↑ ↓ → for each           │
└─────────────────────────────────────┘
Update it every Monday. It takes 10 minutes. If you can’t fill this in, you’re not close enough to your users.
What to Do When Metrics Look Bad
Here’s the decision tree:
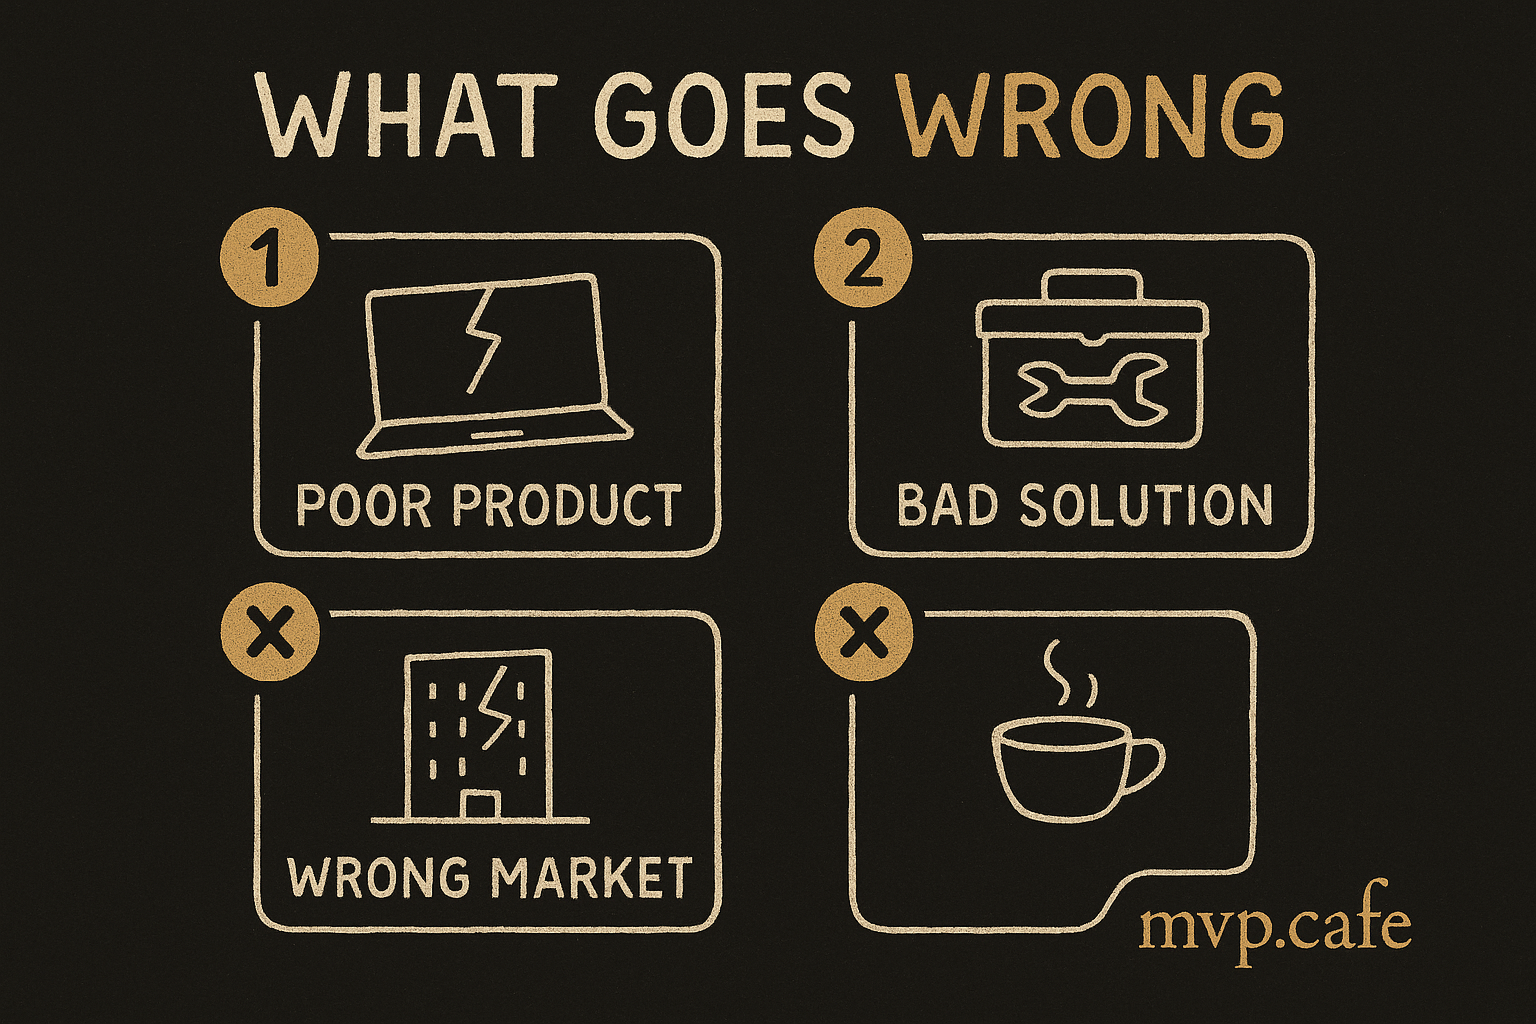
Low activation + low retention: Your product doesn’t solve a real problem for this audience. Talk to users. Consider pivoting the audience (not the product).
High activation + low retention: Your product delivers initial value but doesn’t sustain it. Add reasons to return. Check if it’s a “use once” product that needs a different model.
Low activation + high retention: Your onboarding is broken, but the product is strong. Fix the first 5 minutes of the user experience. This is the easiest problem to solve.
High activation + high retention + no revenue: You have a great free product. Time to test pricing. The value is proven — now capture some of it.
Everything looks good but growth is flat: Distribution problem. Your product works; nobody knows about it. Focus on content, communities, partnerships, or ads.
Stop Measuring. Start Shipping.
The biggest trap for early founders: spending more time measuring than building.
At the MVP stage, you need enough data to make decisions. Not dashboards. Not A/B tests with 12 users. Not attribution models.
Talk to users. Watch the 5 numbers. Ship improvements. Repeat.
Everything else is procrastination in a data-analyst costume.
Want to know if your MVP metrics are on track? Take the Build Score — free, 3 minutes. It evaluates your strategy, product, and market readiness in one snapshot.
Need help figuring out what your metrics are telling you? A Strategy Sprint includes a full metric audit and action plan. $197, done in a week.